

A complex n8n workflow can be perfectly functional and still be difficult for a teammate to understand. Branches, retries, sub-workflows, and external services may all fit on one canvas, but a crowded canvas does not explain why each step exists or what happens when it fails. The right n8n workflow visualization techniques turn that canvas into documentation people can use to collaborate, onboard, and troubleshoot.
This guide shows how to choose a useful diagram format, document runtime behavior, and keep diagrams aligned with the live automation. You will also learn where visual workflow documentation tools and an n8n workflow diagram generator can help—and where human context remains essential.
n8n workflow visualization techniques for shared understanding
Start by treating a workflow diagram as a communication aid, not a decorative copy of the editor. The editor shows node connections; a team-facing explanation must also make the workflow’s purpose, boundaries, and important decisions easy to find. Before drawing, state what starts the automation, what outcome it produces, and who owns it. Those three facts give readers a mental frame before they inspect individual nodes.
Then identify the audience. A developer maintaining an API integration needs to see authentication boundaries, error handling, and data transformations. An operations lead may need to know which system receives the final update and when a human must intervene. A new teammate needs a sequence they can follow without knowing every node type. One giant diagram rarely serves all three audiences equally well.
Use a small set of visual conventions consistently. For example, label trigger nodes as entry points, group related steps by business function, and distinguish normal processing from exception handling. A legend can explain boundary styles or colors, but keep the palette restrained. Color should encode meaning, such as “human review” or “external system,” rather than simply making the page look busy.
Consider a lead-enrichment workflow. A webhook receives a form submission, a validation step checks required fields, a CRM lookup searches for duplicates, and a branch either updates an existing record or creates a new one. The automation may then notify sales. If the diagram only reproduces node names, a reader must infer the business logic. If it labels the branch “existing contact?” and names both outcomes, the decision becomes understandable at a glance.
Useful n8n workflow visualization techniques also make boundaries visible. Show which steps run inside n8n, which rely on external services, and where data leaves your environment. That context helps teams discuss permissions, ownership, and the impact of a service outage. For security reviews, pair a process diagram with the controls in the n8n workflow audit checklist, rather than trying to fit every risk detail into the same image.
Agree on a few documentation rules before a team creates dozens of diagrams. Decide how to name workflows, how to identify owners, how to mark optional paths, and where the authoritative diagram lives. Without shared conventions, different contributors may represent the same behavior in incompatible ways. A short style guide is enough: one page defining labels, line types, ownership metadata, and the minimum information required for publication.
Finally, use the diagram to prompt questions, not to end discussion. Ask a teammate to explain the workflow’s main path and its failure path using only the visual. If they cannot tell where execution begins, what condition changes the route, or who is alerted when a service fails, revise the diagram. That quick review exposes gaps before they become onboarding delays or incidents.
n8n workflow visualization techniques: choose the right view
Not every workflow needs the same visual format. The n8n editor canvas is useful for inspecting actual nodes and connections, while a simplified process map can explain the business sequence to a broader audience. A data-flow diagram emphasizes what information moves between systems. A sequence diagram can clarify timing and interactions among services. Choose the smallest view that answers the reader’s question, then link it to deeper technical details when needed.
For a small, linear workflow, the canvas itself may be sufficient if node names are clear and the route is easy to follow. For a workflow with several branches, nested workflows, or error routes, create a summary diagram first. Represent a cluster of low-level steps as one labeled stage—such as “Normalize customer record”—and provide a second, detailed view for maintainers who need to inspect the internal sequence.
Visual workflow documentation tools can help teams produce consistent diagrams, especially when several people contribute. General-purpose diagramming applications offer flexible shapes and collaboration features. Text-based diagram formats, including Mermaid, are convenient when a diagram should live beside source-controlled documentation. The official Mermaid documentation explains its syntax and supported diagram types. Select a tool based on how your team reviews and updates information, not on the number of templates it offers.
An n8n workflow diagram generator may speed up an initial draft by turning workflow structure into a visual map. Treat generated output as a starting point, not as approved documentation. A tool can often identify nodes and connections, but it may not know why a branch exists, whether a step is safe to retry, or which failure should page an operator. Verify every generated label and add the operational meaning that the workflow definition alone cannot provide.
Before committing to a tool, test it against a real workflow with at least one conditional branch, an error route, and a sub-workflow. Check whether the output remains legible when printed or viewed at normal screen size. Confirm that a teammate can review changes, that diagrams can be exported in a durable format, and that the source can be stored where the team already maintains technical documentation. A visually polished but isolated diagram is likely to become stale.
Make the format match the question. Use a high-level process map to show the business outcome and responsible teams. Use a node-level view for maintainers who need to connect a diagram to the n8n editor. Use a data-flow view when privacy, transformation, or system boundaries matter. You can link these views together rather than compressing every concern into a single image.
There is a trade-off between detail and readability. If you show every field mapping, configuration choice, and retry setting in the overview, readers may miss the main path. If you hide all technical details, maintainers may be unable to act. A practical solution is layered documentation: a one-screen summary, a technical diagram, and concise notes for configuration or edge cases. Each layer should point to the next so readers can move from overview to implementation without searching.
Map execution paths, data, and failure behavior
To document a workflow accurately, follow what happens during execution rather than drawing a tidy idealized sequence. Begin at the trigger and trace the normal path to its final effect. Then inspect every conditional branch, loop, wait, and call to another workflow. Mark a branch only when its condition changes what happens next, and label its outcomes with words that describe the condition or result. “Yes” and “No” can be ambiguous when separated from the decision that produced them.
Next, capture the data transformations that affect downstream behavior. You do not need to reproduce every field in a diagram. Instead, name the important object or values at the boundary: “validated order,” “customer ID,” or “redacted payload.” Add a brief note when a node reshapes data, drops optional fields, or combines information from multiple sources. This makes it easier to locate the step responsible when a later service receives an unexpected value.
Make external dependencies explicit. Label the system associated with each integration and identify the direction of meaningful data movement. If a workflow reads from a CRM and writes to a ticketing platform, the diagram should make those boundaries easy to spot. Include a concise note about the authentication or permission boundary when it affects operations, but never place secrets, tokens, or sensitive sample values in the diagram.
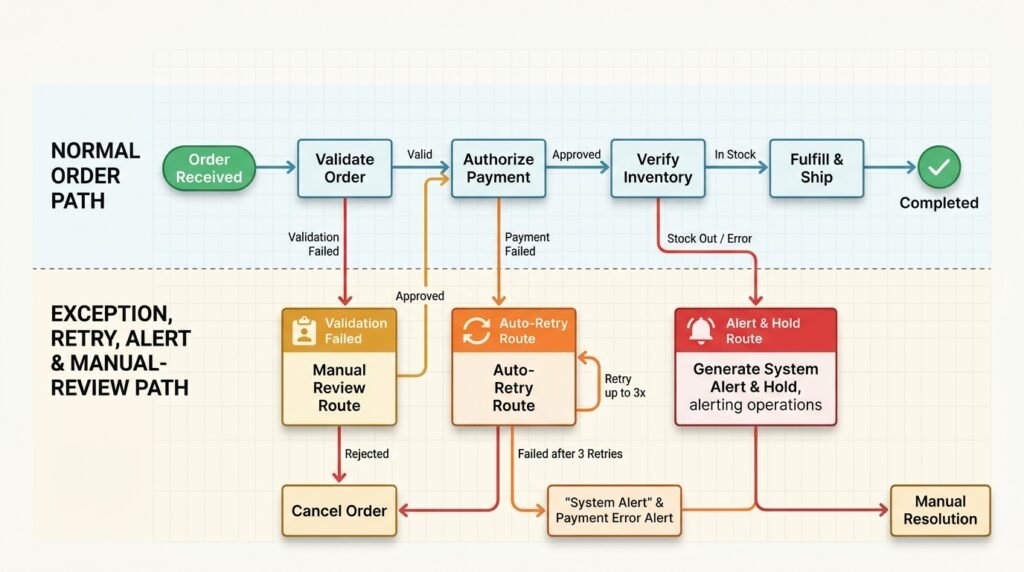
Error behavior deserves its own path. Show what happens when an API times out, a required field is missing, or a downstream service rejects a request. Does execution retry, send an alert, route to an error workflow, or stop for manual review? Label the route and indicate who owns the next action. A line returning to an earlier step can imply an infinite loop, so distinguish a bounded retry from a normal processing path.
For example, imagine an order workflow that receives a webhook, validates the payload, checks inventory, and submits a fulfillment request. The map should show the unavailable-inventory branch separately from an API failure. Those outcomes have different consequences: one may notify a customer or queue a backorder, while the other may retry and alert operations. Drawing both as a generic “error” path hides the decisions responders need during an incident.
Use n8n workflow visualization techniques to show these distinctions without turning the overview into a configuration dump. A useful annotation might say, “Retry transient errors twice, then route to the alert workflow,” while a linked technical note records the relevant settings. The summary tells a responder what to expect; the deeper note tells a maintainer where to verify the implementation.
Finally, compare the diagram with a real execution. Use a representative successful run and, when possible, a controlled failure run. Check whether the observed node order, branch outcomes, and alerts match the illustration. This simple validation catches misleading assumptions, including paths that appear possible in the editor but are not used in the current configuration. For systematic checks of expected behavior, see these n8n workflow testing strategies.

Turn workflow diagrams into onboarding and operating guides
A diagram becomes more valuable when it supports a real team task. For onboarding, use it to explain the workflow’s purpose, owner, trigger, and expected outcome before introducing the node-by-node implementation. A newcomer can first learn the business process, then trace how n8n implements it. This sequence reduces the risk that someone memorizes node names without understanding which actions are important or reversible.
Pair each diagram with a short “how to read this” note. Define any team-specific labels, explain the main route, and point out the most consequential branch. Add links to the live workflow, related runbooks, and the team channel or owner responsible for questions. Keep the note focused: the goal is to help someone find the right next step, not to repeat every detail visible in the diagram.
For troubleshooting, add operational cues. Identify where a failure becomes visible, which notification is sent, and what evidence an operator should collect before changing the workflow. For example, the documentation might direct responders to check the execution record, confirm whether the external service is available, and compare the incoming payload with the documented required fields. Avoid instructing readers to replay production data blindly; retries can create duplicate records or trigger downstream actions twice.
Document consequences as well as actions. If a human can approve, reject, or amend a record, show where that decision enters the process and what the automation does next. In approval-heavy workflows, a separate design reference can clarify gate options; the n8n workflow approval system guide offers examples of approval gate designs. Link to such focused guidance rather than crowding the diagram with process policy.
Organize visual workflow documentation tools and supporting files around how the team works. Put diagrams near the relevant workflow instructions, not in a detached folder with no ownership. Give each artifact a descriptive name and a clear relationship to the n8n workflow. If the team maintains source-controlled documentation, keep editable diagram source beside the rendered image so a future maintainer can update both.
Use the diagram in onboarding sessions as an active exercise. Ask the new teammate to trace a successful execution, explain one branch, and identify the next step after a named failure. If they hesitate, note which label or link would have helped. This feedback loop improves clarity faster than asking whether the image “looks good.” It also reveals whether the process depends on undocumented knowledge held by one person.
Operational guides should distinguish safe investigation from actions that change data. Mark whether a step is read-only, whether a replay is safe, and when escalation is required. A diagram should not attempt to replace access controls or incident procedures, but it can direct the reader to them. For workflows that coordinate several services, a broader workflow orchestration pattern reference can explain why responsibilities are split across workflows.
When an n8n workflow diagram generator is used for onboarding material, review the output with a person who understands the process and a person who is new to it. The experienced reviewer checks for accuracy; the newcomer checks whether the explanation is intelligible without insider context. That two-perspective review catches both technical mistakes and unexplained assumptions. Document the owner and review date in the surrounding page, not as tiny text embedded in the image.
Keep diagrams accurate as workflows evolve
Outdated documentation can be more harmful than no diagram because teammates may trust a route that no longer exists. Make diagram maintenance part of the workflow change process. When a developer adds a branch, changes a service, or modifies error handling, ask whether the documentation needs an update in the same review. This simple ownership rule prevents diagrams from becoming a separate project that is postponed indefinitely.
Store the diagram close to the workflow’s operating instructions and make the canonical version obvious. If teams keep copies in a wiki, presentation deck, and shared drive, label which one is authoritative and link to it from the others. Avoid editing a screenshot of the n8n canvas as the only record: screenshots can be useful for orientation, but they are difficult to revise and may conceal important behavior when cropped or reduced.
Agree on lightweight review triggers. Revisit the diagram when the trigger changes, a new external system is added, a branch alters business outcomes, or the escalation path changes. You do not need to redraw the entire map after every cosmetic edit. Instead, review the affected section and confirm that labels, ownership, and linked runbooks still match the live workflow.
For larger teams, use a checklist in the pull request or change request. It might ask whether the start condition is accurate, whether new branches are labeled, whether error handling is shown, and whether data boundaries remain correct. If a change has no visual impact, say so explicitly. This small step creates accountability without requiring a separate documentation approval meeting for every adjustment.
An n8n workflow diagram generator can help compare workflow structure or speed up updates, but automated output should not be treated as a source of truth about intent. A generator may show a newly connected node while missing the operational reason for the connection. Keep human-maintained notes for decisions, ownership, and recovery procedures. Use generated diagrams where they reduce repetitive work, then verify the result against the editor and a representative execution.
Track quality through practical outcomes. Can a new teammate find the workflow owner? Can an operator distinguish a business exception from a technical failure? Can a reviewer see where customer data moves? If people still ask the same basic questions, update the diagram or the surrounding guide. Avoid vanity measures such as the number of shapes or pages; a smaller, accurate map is often more useful than a comprehensive but unreadable one.
As complexity grows, split documentation by purpose. A high-level map can show the main stages and handoffs, while linked diagrams explain specific sub-workflows or recovery paths. Keep the links named so readers know what they will find. These n8n workflow visualization techniques work best as a maintained system of related views, not as a single poster expected to answer every question.
Set an owner for each important workflow and make that responsibility visible. The owner can coordinate reviews, but should not be the only person capable of editing the documentation. Shared conventions, editable sources, and clear links enable a backup maintainer to make safe updates. This matters especially when a workflow supports a critical business process and knowledge must survive team changes.

For further reading, see the official n8n documentation.
FAQ: n8n workflow diagrams and documentation
What should an n8n workflow diagram include?
Show the trigger, main stages, meaningful decisions, external systems, important data transformations, and failure routes. Add an owner and links to the live workflow or operating guide outside the diagram.
Can I use the n8n canvas as team documentation?
Yes, when the workflow is small and the node labels are clear. For complex processes, supplement the canvas with a business-level map and concise operational notes so non-specialists can follow the logic.
Are visual workflow documentation tools required?
No. A simple, consistently maintained diagram can be enough. Choose visual workflow documentation tools when they improve collaboration, versioning, or readability for your team.
Is an n8n workflow diagram generator accurate?
It can help create a structural draft, but review it against the live workflow and execution behavior. Add intent, ownership, and recovery guidance that automation cannot infer.
How often should workflow diagrams be reviewed?
Review them whenever a change affects triggers, branches, data movement, external systems, or escalation behavior. A periodic check can also catch drift when workflows change outside a formal review process.
How do n8n workflow visualization techniques help troubleshooting?
They make routes, dependencies, and recovery actions easier to locate, helping responders narrow down where behavior diverged from expectations.
Conclusion: make complex workflows easier to share
Clear diagrams explain more than which node connects to the next. They show purpose, decisions, data boundaries, ownership, and what the team should do when execution fails. Start with the audience and the question they need answered, then build a layered view that reflects real behavior. Keep the source editable and review it whenever meaningful workflow logic changes.
Apply these n8n workflow visualization techniques to one complex automation first: map its normal path, document its failure routes, and ask a teammate to use the result. If you want help making automation easier to operate and scale, talk with Seelaunch about your workflow documentation and AI automation needs.