

When several n8n workflows run across multiple instances, a problem can hide in a queue, an execution history, or a separate server’s logs. A well-designed n8n workflow monitoring dashboard brings those signals together so your team can see what is running, what is failing, and where to investigate. The goal is not merely a wall of charts. It is a dependable operating view that connects workflow execution tracking with clear ownership and timely action.
This guide explains how to plan the data model, collect execution and infrastructure signals, build useful views, and configure alerts. It also covers important trade-offs around retention, privacy, and multi-instance deployments, so you can build a system that supports real operational decisions rather than adding another dashboard nobody checks.
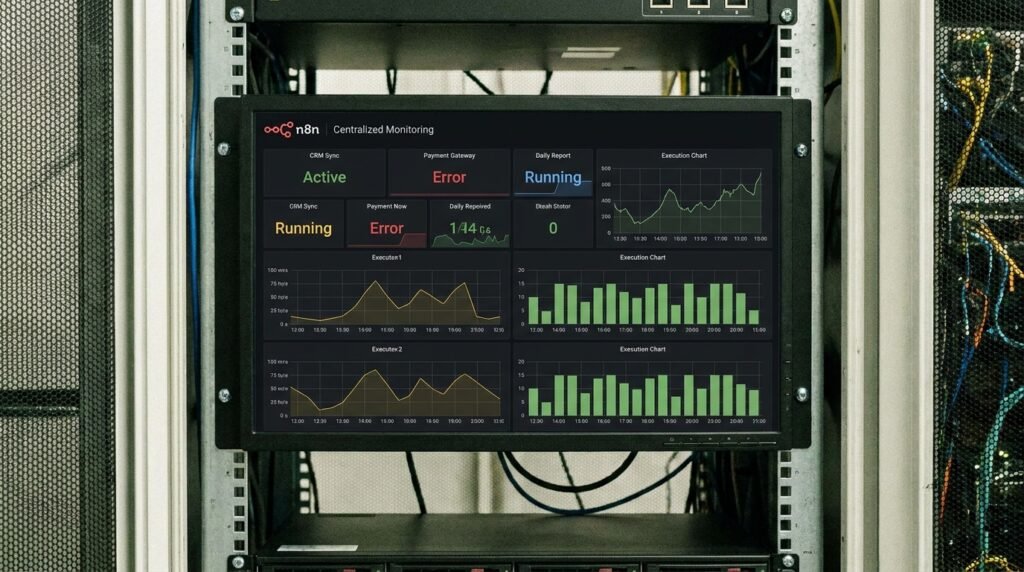
1. Define What Your n8n Workflow Monitoring Dashboard Must Answer
Start with operational questions, not chart types. A dashboard is useful when it helps someone decide whether automations are healthy and what to do next. Before choosing a metrics backend, list the decisions your operators, developers, and business stakeholders need to make. This keeps the project focused and prevents a common failure: collecting every available metric without making any of them actionable.
For each workflow, define whether it is business-critical, who owns it, and what a successful run means. A nightly data sync might be healthy if it finishes before a reporting deadline, while a customer-facing webhook might need near-immediate processing. Those workflows should not share identical service targets simply because they run in the same n8n environment.
A practical first version of an n8n workflow monitoring dashboard should help answer these questions:
- Are workflows running, succeeding, and completing within an expected time range?
- Which workflows have new failures, repeated retries, or a growing backlog?
- Are problems limited to one workflow, one worker, one instance, or a shared dependency?
- How many executions are affected, and when did the issue begin?
- Who owns the workflow, and what is the next diagnostic step?
Use a consistent identity model across instances. Assign each environment a stable name, such as production or staging, and distinguish it from the instance identifier. Give workflows a readable label and, where possible, a stable workflow ID. Record an owner or team and a criticality tier in a controlled inventory. Names alone are not enough: teams rename workflows, and similar labels may exist in separate environments.
Decide which signals belong in the first release. Execution outcomes, duration, timestamps, workflow identity, and instance are a sensible baseline. Add queue depth, worker health, and resource usage when your deployment architecture makes them relevant. Avoid collecting personal data, request bodies, credentials, or entire execution payloads just to make a dashboard appear comprehensive.
Define a small set of service indicators before setting thresholds. For example, measure the percentage of successful executions over a rolling period, the proportion completed within a workflow’s expected time, and the age of the oldest queued item. Establish an appropriate observation window and minimum execution volume; a workflow that runs twice a week needs a different interpretation from one that runs thousands of times per hour.
Finally, document what each panel means and who responds when it changes. A clear definition of “failure rate” should state whether manual retries and expected business rejections count. That shared vocabulary makes it easier to compare instances without confusing an intentional workflow outcome with an infrastructure incident.
2. Collect Workflow Execution Tracking Data Reliably
Central monitoring depends on consistent data collection. n8n execution history can provide workflow-level context, while deployment metrics and logs help explain what the platform was doing when an execution slowed or failed. Treat these as complementary sources: execution records describe automation outcomes, and infrastructure signals provide context about the service that ran them.
Choose the collection method that fits your deployment and the detail you need. Depending on your n8n version, hosting model, and configuration, you may use built-in monitoring endpoints, the n8n API, database-backed execution records, structured logs, or a combination. Check the relevant official n8n monitoring documentation for supported options and configuration. Do not assume that an endpoint or metric is enabled by default; verify behavior in a test environment before relying on it.
For each execution event, aim to capture a compact set of fields: workflow ID, workflow name or label, environment, instance, execution ID, start and finish times, final status, duration, and an error category when applicable. Include a trigger type or workflow owner if these fields are available and safe to export. Keep event names and status values consistent across all instances so a central query does not have to interpret a different schema for every source.
There are two useful patterns for transporting this data. A pull-based collector periodically queries supported endpoints or databases, which can be straightforward when network access and authentication are controlled. A push-based approach sends events or metrics to a central service as they are produced. Push can reduce collection delay, but it requires reliable delivery, retry behavior, and a plan for duplicate events. In either model, make the collector observable too: track its last successful poll, errors, and processing lag.
Use the right storage shape for each signal. Time-series metrics work well for counts, rates, durations, and resource measurements. Logs and structured execution events are better for individual failure details and investigation. A relational store can support inventory, ownership, and reporting joins. You may use one platform for several of these needs, but make retention, access controls, and query performance explicit rather than assuming one data store is ideal for everything.
When instances send data to a central Postgres database, plan the integration carefully. Separate monitoring records from production execution data where practical, use a least-privilege account, and avoid turning frequent dashboard queries into extra load on the automation database. Our guide to n8n Postgres database integration patterns can help with connection and data-flow planning. For self-hosted environments, review the operational choices in this n8n Docker Compose setup guide before adding monitoring services.
Reliability depends on handling gaps and duplicates. Give every event a stable identity, record when the collector received it, and make ingestion idempotent where possible. Flag stale sources instead of displaying old data as if it were current. If one instance stops reporting, the dashboard should show that monitoring has gone blind, not quietly present an outdated green status.
3. Design the n8n Workflow Monitoring Dashboard Around Decisions
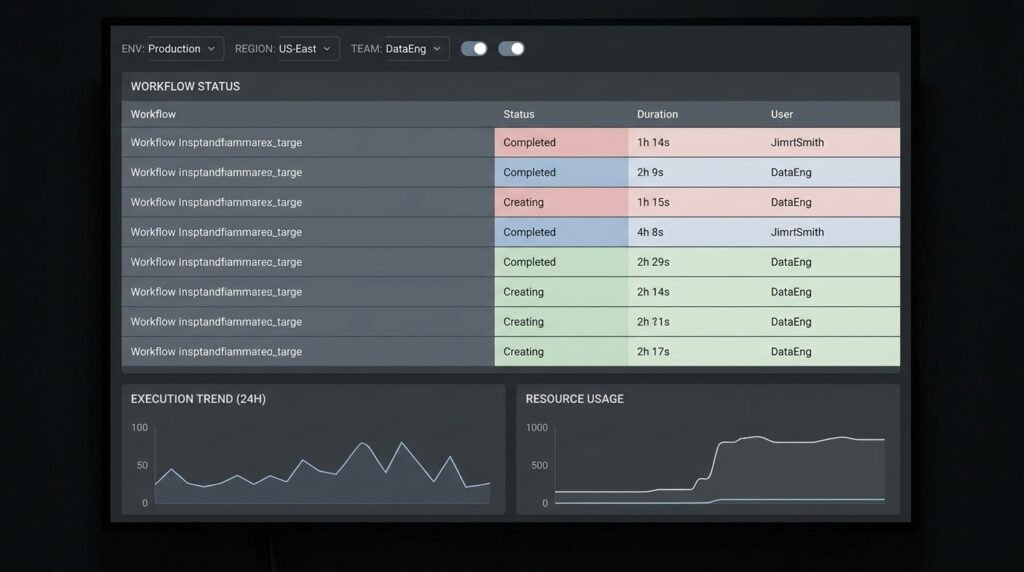
Build the main view for triage, then provide detail views for diagnosis. The top of an n8n workflow monitoring dashboard should quickly reveal whether the platform is healthy, whether the data is fresh, and which workflows need attention. Place broad indicators above detailed charts, and make sure each high-level number can be filtered or opened to show the underlying workflows and executions.
A useful overview typically includes successful and failed execution counts over a selected interval, success rate, median or percentile duration, active or waiting executions where available, and the number of workflows with recent failures. Show the time range and environment prominently. A headline success percentage without its period, execution volume, and environment can easily mislead someone who is deciding whether to respond to an incident.
Use a workflow table as the operational backbone. Include workflow name and ID, instance, owner, criticality, most recent execution, latest status, recent failure rate, and typical duration. Add sorting and filters for environment, owner, status, and importance. A row should answer “what should I inspect?” and link to the most useful next view, such as an execution record or relevant log search, without exposing sensitive payloads to every dashboard user.
Choose charts that explain change. A time series of success and failure counts can show when behavior shifted; a duration percentile chart can reveal slowdowns that an average hides. A heat map by hour or day may expose schedules that collide or downstream systems that become unreliable during specific windows. Use a bounded number of visual encodings and label units clearly. A duration displayed in seconds should not silently change to milliseconds between panels.
Keep failures distinguishable from expected outcomes. If a workflow uses conditional branches to reject invalid input intentionally, do not label every such business result as an infrastructure failure. Define status categories with workflow owners, then document them in the dashboard. For workflows with multiple branches, an understanding of n8n conditional logic and branching patterns can help teams interpret the route an execution took before they assign a failure category.
Make filters apply consistently across the page. Selecting production should update summary cards, trend charts, and the workflow table together. Display the selected time range and timezone, and provide a way to compare with a previous period when useful. If an operator changes filters while investigating, preserve those choices when they open a detail view and return.
Resist the temptation to put every available metric on the first screen. Put platform-level signals—such as worker availability, queue depth, CPU, or memory—in a clearly labeled infrastructure area. Keep workflow outcomes separate from host health so a team can tell whether a slow run is a single automation problem or part of a wider capacity issue. The best n8n workflow monitoring dashboard makes a small number of urgent conditions obvious while retaining enough context to explain them.
4. Connect Multiple n8n Instances Without Losing Context
Centralization is more than pointing several data sources at one screen. Each instance needs a reliable identity, a consistent schema, and a clear boundary between environments. Without those basics, a combined chart can merge staging and production, count the same execution twice, or hide a silent instance behind a healthy-looking total.
Create an instance registry before integrating all sources. For every instance, record a stable identifier, environment, region or location when relevant, n8n version, deployment mode, owner, and collector status. Keep secrets out of the registry; store credentials in a secret manager or another approved mechanism. Make the identifier explicit in every emitted record, even if an upstream source appears to imply it.
Normalize key fields at ingestion. Different instances may use different workflow names, status labels, or timestamps. Translate them into a shared schema while preserving the original values when needed for troubleshooting. Store timestamps in a consistent standard such as UTC, then display them in a user’s chosen timezone. Keep the original execution ID and source instance so operators can locate the record in the correct environment.
Think carefully about how multi-instance totals are calculated. Summing execution counts across a fleet is usually meaningful, but an overall success rate should be weighted by execution volume rather than calculated as a simple average of per-instance percentages. For example, an instance with ten runs should not contribute as much to the fleet-wide rate as an instance with ten thousand runs. Show per-instance breakdowns alongside fleet totals so an outlier is not concealed.
In queue-mode deployments, separate the health of the main process, workers, and any supporting services that matter to your setup. A healthy main process does not prove that workers are processing jobs, and a low recent failure count does not prove the queue is moving. Track queue depth and oldest-item age where the deployment exposes them, and correlate those signals with execution completion time. Document which components exist in each environment so missing infrastructure metrics are not mistaken for zero usage.
Protect the monitoring pipeline from becoming a new single point of failure. Use buffering or retry behavior that matches the importance and volume of the data, and make loss or delay visible. Monitor collector lag, ingestion errors, and the latest received timestamp for every instance. Define what happens during a network partition: events may be retried later, stored locally temporarily, or unavailable. The right design depends on operational requirements, but the limitation should never be hidden.
Access controls matter when a central view spans teams. Give users the minimum level of access required to see their workflows, and restrict execution details that could reveal personal information or business data. Aggregate operational metrics where possible, apply retention limits to detailed records, and document who can query raw events. A central n8n workflow monitoring dashboard should make cross-instance health easier to understand without turning into an unrestricted copy of every execution payload.
Test the combined view with a deliberately varied sample: one instance with a healthy workflow, one with a failing workflow, and one source that stops reporting. Confirm that filters distinguish all three, that totals are correct, and that missing data is labeled as unknown or stale rather than healthy. This test catches many integration errors before the dashboard becomes part of incident response.
5. Set Alerts, Ownership, and Ongoing Health Checks
A dashboard helps people inspect system health; alerts help them notice conditions that need action. Alert on a meaningful operational impact rather than every metric movement. A useful notification identifies the affected environment and workflow, explains the condition, includes the time window and observed value, and points to a runbook or diagnostic view.
Use thresholds that reflect workflow purpose. A customer-facing automation might need an alert after a small number of consecutive failures, while a weekly report should not page someone for a single delayed execution minutes after its usual start. Consider both fixed limits and baselines. A static duration threshold is easy to understand, but a workflow with variable input volume may need a percentile comparison or a volume-aware rule.
Reduce alert noise by grouping related events and requiring a meaningful duration or count before notification. A brief worker restart should not create a flood of identical messages if the service recovers quickly. Conversely, a sustained rise in queue age may be important even when individual executions have not yet failed. Use separate severity levels for urgent service disruption and issues that can be reviewed during normal operations.
For each alert, define an owner and response expectation. Route workflow-specific alerts to the team responsible for that automation, and platform alerts to the operations team. If ownership is unknown, create an explicit escalation path rather than leaving the alert in a shared channel with no accountable responder. Include a short runbook: first confirm data freshness, then check the instance and workflow, inspect recent execution details, and review relevant infrastructure signals.
n8n’s error workflow features can complement central alerting by handling failures inside the automation environment. They are not a substitute for independent monitoring: an error workflow may itself fail, a source may stop reporting, or a platform-level issue may prevent it from running. For a practical approach to workflow-level recovery and notifications, see these n8n error-handling patterns. Combine that approach with external health checks so problems in the monitoring path can be detected.
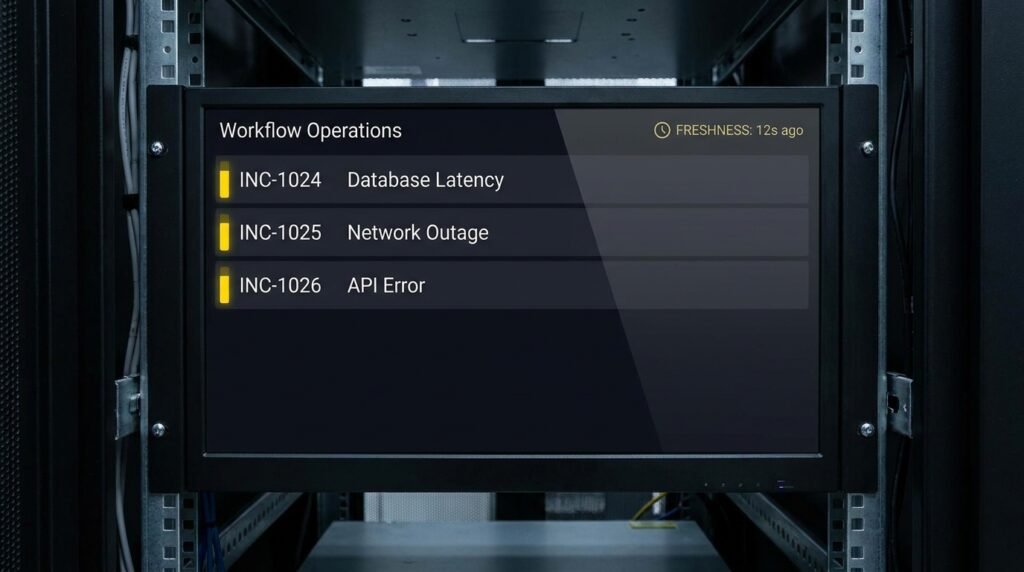
Measure the monitoring system itself. Track the age of the newest event from each instance, collection success, ingestion delay, dropped or duplicated events, and dashboard query failures. Set a clear stale-data threshold based on how often an instance should report. If the expected cadence differs by environment, configure it per source rather than applying one global timer.
Validate alert rules with controlled tests. In a non-production environment, create a known failure or delay, then verify that the record reaches storage, appears in the correct dashboard view, triggers the intended notification, and includes the right owner and link. Test recovery too: confirm that the alert clears or resolves after the condition ends. Record the test and repeat it after significant changes to collectors, schemas, or n8n configuration.
Review the system periodically with workflow owners. Remove obsolete workflows from active alerting, update ownership after team changes, and adjust thresholds when normal execution patterns shift. This keeps automation health monitoring focused on risks that matter instead of accumulating stale panels and alerts. Treat observability as a maintained product: someone owns its data quality, access rules, and usefulness.
For further reading, see Google Search Central.
FAQ: n8n Monitoring and Execution Metrics
What should an n8n monitoring dashboard show first?
Start with success and failure counts, recent execution duration, the affected workflows, the environment, and the freshness of collected data. Add ownership and a direct path to useful diagnostics. These basics support rapid triage without overwhelming operators with low-priority infrastructure details.
Can I monitor multiple n8n instances in one dashboard?
Yes. Give each instance a stable identity, normalize execution fields and timestamps, and label every record with its environment and source. Show both fleet-wide totals and per-instance results so one unhealthy source does not disappear inside an aggregate.
How does a centralized view support workflow execution tracking?
A centralized n8n workflow monitoring dashboard makes execution status, duration, workflow identity, and instance visible in a shared operational view. It should preserve the execution ID and link operators to appropriate details while limiting exposure of sensitive input and output data.
Should I store full execution payloads for monitoring?
Usually not. Store the smallest set of metadata needed to measure performance and investigate failures. Full payloads may contain personal, confidential, or credential-related information. If detailed records are necessary for a separate purpose, apply access controls, retention limits, and a documented privacy review.
What is the difference between workflow monitoring and infrastructure monitoring?
Workflow monitoring describes automation outcomes, such as completion rates, failures, and durations. Infrastructure monitoring describes the service that runs them, such as workers, queues, and resource usage. Correlating both helps distinguish a workflow-specific defect from a wider platform issue.
How often should I review alert thresholds?
Review them when workflows change, normal volumes shift, ownership moves, or repeated false alarms occur. Also test alerts after meaningful changes to collectors and deployment configuration. A regular review cadence helps keep notifications useful, but high-impact changes should prompt an immediate check.
Conclusion: Make Monitoring Operational
A dependable monitoring system combines trustworthy execution data, consistent instance identity, useful dashboard views, and alerts with clear ownership. Start with the workflows and decisions that matter most, then expand collection and visualizations as the team learns what helps it respond. Keep data fresh, protect sensitive details, and test the full path from an n8n execution to an operator’s next action.
With those foundations in place, an n8n workflow monitoring dashboard can turn scattered signals into practical oversight across workflows and instances. Seelaunch LLC helps businesses design AI automation systems and operational workflows. Talk with Seelaunch about building more reliable automation.